
This study has been on my mind as a conceptual experiment for about a year and I finally tackled it April 2019. I already modeled the “thermal warming capacity” of the nose and addressed humidification to be “synchronous” to my thermal results. Now we look at the last of the 3 MAIN functions of the nose: FILTRATION. I saw that our lab owned particle counter was due for calibration on the rack at work and decided to make quick use of it on it’s way out the door 🙂 The whole test took 3 hours from start to finish so I am kind of shocked and saddened as usual that E.N.T. doctors have not bothered to study and report on this topic in detail anywhere that I have seen. They readily admit that the nose has 3 main functions yet advocates of nasal Turbinate reduction techniques have a piss poor record of presenting any actual hard data (measurements) anywhere in their studies that they say supports their views. MOST conspicuously missing, is data regarding the 3 basic functions!!! I would actually add a 4th function: regulation of breathing during sleep which I have proven and other studies have mentioned as fact. You would think that studies advocating for reduction would present data for humidification, warming and filtration but they don’t. Maybe a pulmonary stress test, but the main thrust of their “research” seems to be to cut parts off and ask people if they can breathe more air through their nose.

The results were fairly obvious to me (or any rational person) and that is simply that turbinate reduction surgery impairs/ destroys your noses ability to guard your lungs from pollution particulates but let’s see how!
My set up is shown below. I used a 14mm diameter syringe body cut open as my nasal “cavity”. My actual real life nasal cavity measures around 11mm so this test is in the neighborhood. I quickly machined 3 different turbinates (12mm, 10mm and 7mm) to insert inside the tube. Note that even my best test case 12mm turbinate still leaves a 2mm gap which is on the edge of being too big. I used plain table honey to mimic a blanket of mucous inside the nose to trap particles. I tested each of the 3 parts in the cavity slathering the tube and turbinates with fresh honey each time. Last I tested just the empty tube to mimic a Total inferior Turbinectomy.


I used CAD software to determine the total “area” of each turbinate and that of the tube. The tube fit snugly over the particle counter input so the counter was forced to breathe through our modeled nose for 60 seconds with each configuration and data was collected. Fear not E.N.T. doctors, data is GOOD!

The results were/are indeed fairly obvious to me. A wider gap severely impacts filtering capability. It allows more particles to pass without being caught by the layer of mucous inside our noses (if you are lucky enough to have any). It allows more (small) sub-micron particles but it allows MUCH MUCH more large particles to pass right through the nose. 5um particles increased as a percent by 430% by going from the 12mm IT to the 10mm IT. It increased 800% going to the 7mm IT and the Total turbinectomy cavity alone increased by 1570% !!!!! So large particles are allowed to pass right through your over opened nose. This is why I have a hard time being on a motorcycle, or cutting the grass. Bus fumes and pollution goes right into my lungs. I can taste it and feel it hit my throat. At 0.7um, the increase is 46%, 81% and 204%. The effect becomes more muted at the extreme small 0.3um end because the smallest of the small go right through even normal noses. This idea is mapped out nicely by the chart below of particle size increase Vs “Total Area” of mucosa tissue. That is why the E.P.A. issues air quality warnings for forest fires and general automobile/industrial pollution smog air quality ratings. They are actually more concerned about small particles because they go deeper into your lungs. They are concerned for normal people but for Empty Nose Syndrome victims, these effects are far more dangerous.
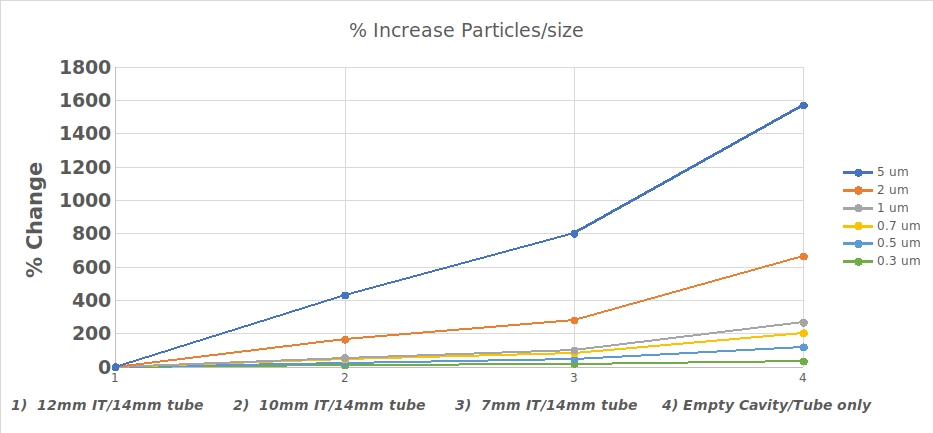
Now the graph above compresses the small particle range that the E.P.A. considers more dangerous. Below, I show the isolated break downs which better show the individual increases of all particle sizes:

Now keep in mind that these results are the particle counts for 60 SECONDS OF LIFE!!! Now TRY TO IMAGINE LIVING LIKE THIS EVERY DAY OF YOUR LIFE!!!! Do the math to see what E.N.S. victims are bringing into their lungs per day, per week, per year!!! Actually, the math is far too depressing for me to think about. Some days my lungs hurt from dryness and pollution. E.N.S. victims in the various online support groups complain of similar issues. Below I will leave you with more information on things such as Diesel and other types of pollution considered dangerous from the E.P.A and others.


