
“That is an extraordinary work you have done. A tremendous sample of data, I would say unique in the whole world. Congratulations!” feedback from (Dr. Marc Oliver Scheithauer)
Here in the year 2017 with some (reported) 40% of doctors still openly questioning even the “existence” of ENS I thought this was a particularly good time to release some hard statistical data that not only proves that ENS does exist but also shows in great detail EXACTLY how and why it destroys one’s ability to sleep.
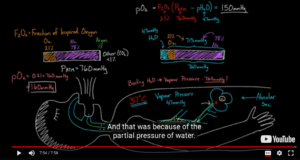
In my Nasal Air conditioning results post I showed how it severely impacts the warming and humidification of inspired air by 50%. When we add in the near total loss of negative pressure then we can also say that Alveolar gas exchange in the lungs is impacted too. The Gas exchange equations (tutorial below) ARE affected in part by pressure, temperature and humidity and radical turbinectomies destroy all three! So how can there be proper gas exchange?
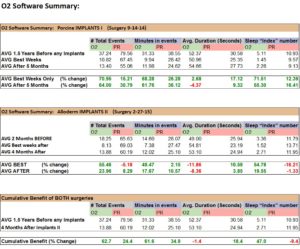
But here, I will also put hard numbers on it’s effect on sleep. My sleep O2 saturation “index” numbers improved by 71% and 55% respectively after ADDING tissue back in my nose! but I learned much more than that. O2 Stability (standard deviation) improved and average O2 levels settled downward to more normal autonomic levels. All standard sleep statistics improved. These results run counter to years of standard ENT doctor reasoning that the nose is something you simply bore a hole through and people are better off.
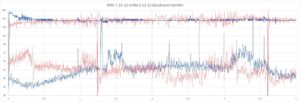
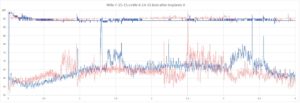
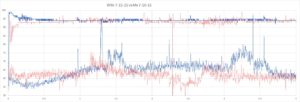
There ARE limits to nasal surgery before physiology is destroyed. Humidification, heating and particle filtering are obvious but the aspect that doctors have been conveniently dismissing for decades is that it causes PERMANENT Central Sleep Apnea!!! The most damning obvious proof I have is presented below first. Every night as I try to sleep, I stop breathing the moment I cross the autonomic threshold. Below I focus on the 2 months of data BEFORE my Alloderm nasal cavity implants and 2 months AFTER implants. The results are OBVIOUS. Chart (1) is a composite average of all nights before Vs. After, charts (2) and (3) are the individual nights graphed together (before Vs after)
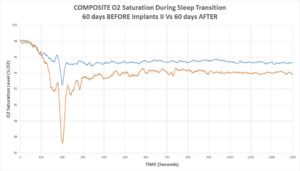
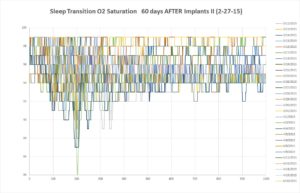
So ADDING material back in my nose made my O2 saturation drops FAR less severe. Pretty obvious proof that nasal surgeries impact autonomic breathing. Next are 2 graphs showing all nights that made up the composite averages. All nights were shifted in time so that the deepest O2 saturation drops all line up at exactly 200 seconds in:

This study now further assesses 271 data points for nightly sleep spread over a 2 year period before and after two re-constructive implant surgeries. Both of these issues (sleep and nasal air conditioning) severely impact and limit a persons quality of life and also life expectancy.
I hope that the 40% of “skeptical” doctors read and fully understand this post as well as the rest of my measured results on this website. Skeptical doctors who claim that ENS is a “mental” and not physical issue were the reason that I started this extensive sleep study. Simply put: I cannot “pretend or imagine” ENS symptoms while I am unconscious.
l will be presenting the following data for O2 and Pulse rate:
>Standard Deviation for O2 and pulse stability, >Basic sleep “Index” numbers, >Number of events per hour, >Average duration of events, >Time in events, >Threshold levels for % of night above or below various levels, >Comparative sleep graphs against a “normal” test subject, >Physical test of intranasal Air temperature which shows shallow breathing.
ALL of my results perfectly align to explain how ENS impacts sleep and even captures changes as the implants settle and partially shrink. Nothing about these results is imagined or subjective. Each method of analysis reveals different layers of interconnected relationships that all come together to explain exactly how ENS destroys one’s ability to attain restful anxiety free and Apnea free sleep.
All “RESULTS” tables can be accessed directly below by clicking the “results” links. The remainder of this study is a lengthier than normal post due the the complexity of the topic.
Results 1: Stability of O2 and Pulse Rates during sleep via “Standard Deviation” (STD-P)
Results 4: A brief look at actual intra-nasal Air temperature during sleep
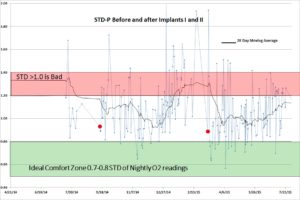
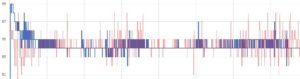
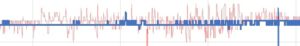
Here are the “daily” stability readings which this study will now statistically analyze in much greater detail. Note the obvious changes before and after 2 implant surgeries shown as red dots below.
One “Standard of Deviation” (σ) is a statistical measure that describes how far away from the “mean” something is. From Wikipedia: https://en.wikipedia.org/wiki/Standard_deviation
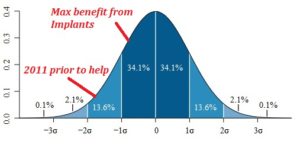
My current life is neatly visualized by looking at the slope above. I am trying to stay closer to the center of that curve and before I got help I was way down in the 1.5 to 2.0 range. The following results come directly from individual nightly sleep data files analyzed by spread sheets which track “daily” measurements. These are not literally taken EVERY day but as often as I felt the need and especially before and after interventions. This study looks at 271 different nights from 2013 to 2015.
Because I am intellectually honest, and my study has scientific merit I am making all data for this experiment publicly available. Feel free to study these things yourself. This site is about scientific discovery and collaboration. Any researchers can feel free to comment or contribute!
You can view my calculation sheets here: https://1drv.ms/f/s!Aj2wgXshhzoAihW9I3696F8B__rU
You can view the individual Nightly files here: https://1drv.ms/f/s!Aj2wgXshhzoAihocIkGuJI0QtQKT
RESULTS STD-P Before and After Two Implant Surgeries:
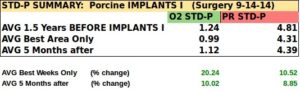
The table above shows that the average standard deviation for my O2 levels for 1.5 years before getting nasal implants was exactly 1.24. I actually removed some files from consideration due to the use of Oils in my nose that would have made that number far higher than 1.24. From personal experience, σ1.0 and above is a painful existence. The same observation applies to my heart as well. My Pulse Rate also became more stable and my heart felt more rested. I was able to handle a lot more physical activity. My heart actually used to hurt. There is a member of the ENS Forum named “Heart Hurts” and this is an apt name because your heart takes a pounding from apneas.
I have found with each implant surgery that there is a “maximum benefit period” immediately after healing from the surgery which lasts roughly 2 months. I believe this maximum benefit comes from the initially large size and shape of the implants prior to varying amounts of shrinkage and settling of physical shape from a nice round structure in the airway to (eventually) a flat wall. The best period after Implants I reached a σ 0.99 average with many readings dipping close to my wife’s normal range of σ 0.7. My sleep was better and I felt less beaten in the mornings. I had less day time anxiety, less dryness, less mental panic and much more physical stamina.
Unfortunately, after my first implants, the Bio-Design Porcine based material shrank considerably over time and everything slowly reverted back toward my prior existence. The “honeymoon” period yielded a 20% improvement in O2 stability that over time, then gave way to only a 10% improvement from a very bad level which was still……. BAD!
I do feel like I retained some of the benefit but by 2015 life was bad enough again to seek a second implant surgery. On 2-27-15 I had my implants “augmented” with Alloderm material with a greater emphasis on anterior size as I my modeling (and cotton tests) had identified as an issue. This time the results were even better. Things felt great and days later I was walking around San Francisco feeling human again for the first time in years. I was breathing normally and I could feel a pull being created up front. I had no apprehension about breathing. I was not out of breath and my nose was not dry. The STD-P levels for that period averaged σ 0.96 with many nights hitting near σ 0.7.
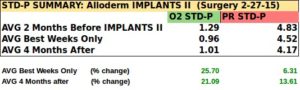
This time the benefits seemed to last longer and after 4 months STD-P was still at a tolerable σ 1.01. The initial improvement was 25.7%!!! After 4 months it receded only slightly to 21.09%. So now we can assess the benefit of BOTH implants by looking at where I was 1.5 years before getting help and where I was 4 months after Implants II.
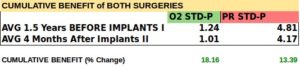
Overall, I saw an 18% improvement in STD-P for O2 stability and a 13.4% STD-P increase in Pulse Rate stability!!! I felt almost human again for the first time since my turbinectomy.
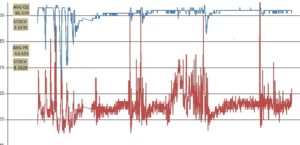
Now for reference, lets look at where I was in 2011 before getting any help when things were REALLY bad. This was recorded with a different device than I used in this study. This was my first ever recording just after my 2011 visit to the emergency room for extreme exhaustion after trying to take a nap. When I got up I was so weak that I fell and I couldn’t get up. I first bought an O2 recorder and started monitoring things because it had an alarm function and I set it to beep if my O2 dipped below 90. It kept going off every time I tried to drift off so I lowered it, then lowered it again. Then I finally turned off the alarm and let whatever was going to happen occur. The alarm only added to the anxiety spikes. Here is a graph from that time period below. With readings like this (O2 σ2.6 and PR σ8.36) you can see why I was in the emergency room.
RESULTS: Comparative Sleep Analysis:
So the Standard Deviation results sound interesting, but what does all this crap actually look like? What does it mean? I am glad you asked!
This is my wife’s recording from 7-15-15 and not even her best. This is our “base case” for “Normal”. 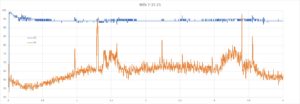
Now this is one of my best nights (after Implants II) and the best I felt in the 9 years since my turbinectomy: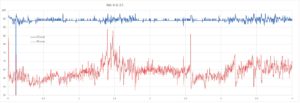
What I would like to point out is that most sleep doctors looking at my chart above would probably see very little wrong. O2 is well above 90 and there are no serious drops although prior to getting Cartilage Grafts in 2012 I did have serious drops. Sleep doctors mostly see obstructive type issues related to nasal obstruction or soft palate and jaw placement related obstruction. They are simply used to seeing a lot of people gasping for air with some form of obstruction. People with aggressive nasal surgeries (and minimal nasal resistance) are a minority of the population and have different issues that these doctors (and most others) are simply not aware of. They see no hint of the type of severe anxiety that ENS victims are complaining about while sleeping.
So after having 3 official sleep studies done and getting nowhere (and poorer) I started looking for answers myself and this is what I found. When I layer my “best” results on top of my wife’s results details start to emerge!
Her data is all in (blue) and mine is in (red) for both O2 and PR. This is one of my BEST readings from the “honeymoon” period after Implants II at STD-P O2 σ 0.88 and PR σ 4.41
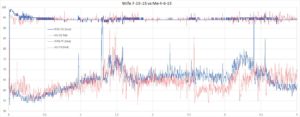
Now I am no sleep expert or doctor, I am just an engineer looking at charts with a critical eye and some life experience. There is a natural timing for sleep cycles which a quick search said last about 90 minutes and that appears to be exactly what I see here. We go through 5 stages of sleep and end in REM sleep. It isn’t hard to observe the slight drop off in O2 at sleep onset and then observe the pulse rate changes that occur and end right at 90 minutes. (No PhD necessary) I also chose this particular night for a comparison study because on this night my wife and I seem particularly “locked in step” so it makes for an excellent comparison of events.
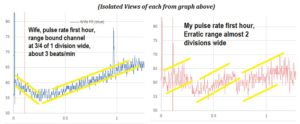
To start with, if we zoom in on just the O2 for the first 2 hours several things emerge right away.
First, the sleep transition for me is a much noisier event with steep drop offs in saturation levels. Without drugs, it is almost impossible for me to even cross the barrier and it’s a very hard and noisy transition that slams you back awake like someone smothering you with a pillow (some doctors think that I imagine this), My wife seems to consistently settle down smoothly from a higher level while awake to lower autonomic stability level. My results show my system literally dropping out then trying to get back up to some kind of smooth autonomic level.
Secondly you can see that my wife’s results are flatter than mine. Hers spend a majority of the time pinned between EXACTLY 94.5 and 95. She has some drops below bounded by support right at 93. My O2 levels are noisy and unsettled in any particular range for very long. My results span a much larger range (91 to 98) and deviate from the median far more often. Remember, I am starting with my best night in 10 years.
Next, we will look at Pulse rate during the first hour. My heart rate is FAR more erratic trying to stabilize my system. Hers is methodically climbing in a channel ranging about ¾ of one division wide or about 3 beats/Minute while mine varies almost 2 full divisions or 10 beats/minute. Hers is also one continuous slow ramp while mine is fractured and truncated into at least 3 different sections over one sleep cycle. At sleep onset her heart slowly drifts downward to a low to start a cycle while mine is experiencing spikes reacting to panic.

So now we can all view the initial superimposed chart I presented and see the many differences that stand out now that we know what we are looking for. Now when we look at the data tables for Standard deviation we have a reference for comparison of what “normal” O2 σ 0.88 and PR σ 4.41 Looks like. Now I can simply post some charts typical of periods before and after Implants.
BEFORE IMPLANTS:
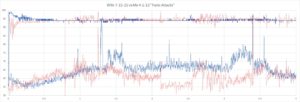
Next I want to show the effect of using Oils and gels to combat dryness. Many doctors just assume that ENS is simply some “dryness and discomfort” so they tell you to just use some gel or oils right? Well oil coats the mucosa and blocks what little sensation you have left. Daytime anxiety is far worse for me using oils and sleep is also worse. Early on every single time I tried using oils I had huge panic attacks soon thereafter. I excluded most data from my tables that say “used oil” because they are all worse than usual with STD in the 1.5 to 2.0 range which PROVES again that nasal feedback is one of the inputs needed in driving autonomic breathing!
AFTER IMPLANTS:
Now here is one of my best nights after Implants…… notice any changes??? Look at how tight the O2 range is!!!! My heart is more relaxed (still busier than hers) and the result is that O2 is WAY more stable for longer periods of time after implants vs. before. So how can ANYONE look at this and tell me ENS doesn’t exist? I had my nose FILLED IN and the results are better!
ENT doctors have NO problem relying on people’s “subjective” feelings to simple questions about nasal congestion to base their entire studies on but then they don’t believe ENS victims when we complain of “subjective” feelings.
Moving on, this is another good night (below) from the “sweet spot” after Implants II with good numbers, yet short in duration. You can see that my O2 range is almost identical in range and noise as my wife’s. My heart seems to be working extra hard to keep things stable but during this time period I felt a lot better and stronger. Even the transition was flat. I hope there are no deniers of ENS past year 2017.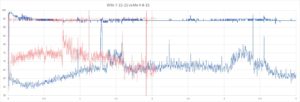
Unfortunately, once again, as you can see in the historical summary graph, the implants slowly shrunk over time. Both times some of the material did indeed stay and I did move forward to a new higher base level. I sought even more help shortly after this next and last night presented from July 2015. I received various injections which did stay put and did help. I was finally fortunate enough to have found excellent care at Stanford University with Dr. Jayakar Nayak. I had seen a LOT of ENT doctors and he is a cut above all in his dedication, patience, skill and compassion. I had never met a doctor that I could talk to like a regular person prior to meeting him.
I can cover the subsequent interventions in a future post. For now, this post is already VERY long. There is a lot of information to convey and to really do a good job it can’t be condensed down to the length of sound bites and Political slogans. It is a serious study of a very complicated issue. My goal was to PROVE that ENS exists and zeroing in on this time period accomplishes that.
I think I have MORE than proved that ENS is surgically caused by damaged or missing nerve endings, that feedback from the nose IS needed for proper autonomic breathing and that implants help to drastically improve life for people who have ENS. The problem however seems to be the longevity of the implants. It’s not that all the material disappears, it’s that the shape flattens and averages out. It’s hard to make large round shapes that stay round over time. Perhaps “Medpor” may retain shape?
To the 40% of doctors who have been denying that ENS exists I would say this:
I have had to PROVE that ENS does exist by presenting factual hard data! What data do you base your opinions on that it does not exist??? I’d like to hear from you!
RESULTS: STANDARD PULSE OXIMETRY ANALYSIS:
These results are rather straightforward and I don’t feel much additional commentary is necessary in that most people understand these types of readings. I will only say that the benefits from implants are strikingly clear.
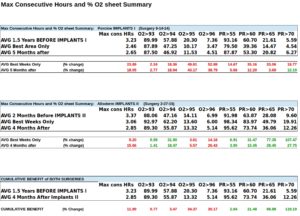
RESULTS: MAXIMUM CONSECUTIVE HOURS/ % O2 LEVELS
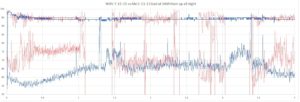
Results from this area initially confused me because I saw O2 results dropping. In my mind I believed in my stability data as an excellent proxy for how I felt with ENS but these next results (a sea of red numbers) always had me cautious thinking that implants made my O2 levels worse until I figured things out recently. My discovery was this: Autonomic O2 levels are SUPPOSED to be lower! My wife routinely drops from 98 to the 93.5 area while sleeping. If you look at most of my sleep charts presented here you’ll notice as I finally did that my O2 was swinging ABOVE normal far too often, especially during unstable noisy periods. (image below)
If you remove all of the O2 numbers above her normal autonomic level center line, you get the results below. In my mind this is due to my brain constantly receiving the message that I am suffocating which causes sleep “arousals”. (No not those kind!) Each arousal during sleep sends you back to a lighter stage of sleep and my brain is constantly slamming my system on and off to keep my system going which keeps O2 much higher!!!!
Below you will notice the drop offs in the percent of the night that my O2 was above 96 and above 95 and an actual INCREASE in the time above 93! The mystery has finally been solved. The maximum continuous hours shows a bit of a drop after implants. This may be subjective and inaccurate in that possibly I pulled my finger out earlier and earlier at the first sign of trouble. I am certain that the amount of time for my “whole” sleep sessions did actually increase from 2-3s up to 4 hour periods. Sometimes I even had a few 5s. The excel sheet also considers a drop below a certain threshold as a flag to stop counting the hours.
Most ENS victims also take drugs in order to sleep. There are endless discussions about this on-line. This is a necessary evil but what I found is that it is not a good idea to drug yourself too heavily because sleeping through panic attacks is worse for you than getting up and re-setting yourself. Every night I am awakened to this sickening feeling that comes on slowly, then as I become conscious I become fully aware that I am under extreme stress. I have to spray to moisten my nose and then allow time for my system to recover from the beating it took. The few times where I tried to drug myself back to sleep too soon I felt a LOT worse. My first sleep session is always the longest 3-4 hours on average ( 3 happens to be 2, 90 minute cycles). The second attempt at sleep is always shorter and worse. In this study wherever I had 2 sessions recorded, I only took the first.
Every morning as I become conscious, I realize that my system is under duress. Trying to sleep more always makes me feel worse. There is no sleeping in. With ENS you only get what sleep your body can extract and no more. For ENS victims more sleep isn’t really healthy. It seems that even while unconscious, there is no break from ENS and my charts show that.
This study shows beyond doubt that ENS and it’s issues are indeed “measurable and physical” in nature as a direct result of nasal surgery and are not “mental” or the least bit subjective. The nose has neural connections that some small percent of doctors either deny or have failed to understand. My life was turned into a “science experiment” by this narrow group of doctors who in 100 years of authoring limited studies and attending conventions have failed to fully understand the scope of their own specialty as a group. There have been great studies by smart researchers who have understood these issues for years but many general ENTs simply disregard this information and do whatever they personally “believe” in. I have no idea what medical schools actually teach but it makes me wonder if they have any standards at all.
The equipment I used for this study is made by “Contec” Model# CMS50FW

The software it uses yields charts and it’s own basic analysis. Here are the parameters:
Desaturation Event = drop in SPO2 by at least 4% for a minimum duration of 10 seconds
Pulse Event = change in rate by at least 6 beats per minute for a minimum duration of 8 seconds
Measured for O2 and PR are the following:
Total number of events, Time in events (minutes), Average event duration (seconds), Index (1/hour), (It measures more but this is what I have centered on as useful to me)