
What is empty Nose Syndrome?
ENS is a debilitating condition that is sometimes the result when too much nasal turbinate or septum tissue is aggressively cut and removed. The more tissue that is removed the higher the risk. It is a complex issue involving multiple factors and often worsening over time, sometimes even 5-8 years after the initial surgery. Typical symptoms are: Nasal dryness and nerve pains, disturbed sleep, anxiety, exhaustion, shortness of breath and a constant sense of suffocation. For a more in depth explanation than I have space to provide here please refer to these links: http://www.ensassociation.org http://www.emptynosesyndrome.org/ and https://en.wikipedia.org/wiki/Empty_nose_syndrome
What is Computational Fluid Dynamics?
Computational fluid dynamics, or (CFD), is a way of using numerical analysis of “Navier-Stokes” equations and computer algorithms to solve and analyze situations that involve the flow of fluids and gases. Modern day software has enabled a much easier analysis of 3D models solving for not only aerodynamics but also thermal modeling too. CFD software takes 3D “solid models” and converts them into a “mesh”. A mesh is a structure of tiny interconnected triangles which take the shape of the former solid model. Each triangle point is a “node” where information is extracted from. The “boundary conditions” are settings on your input and output points that tell the software whether you are setting a directional volume flow rate or perhaps specifying a set velocity or even a pressure. After identifying all of your materials involved such as “air space” or silicon rubber (my choice for the nose since human mucosa flesh was not on the scroll down menu) and setting boundary conditions, you set the model to “solve” and it runs as many iterations as it takes for the results to converge. You can then look at surface planes in the “results” panel and look at slices in any direction that you want to see. You can also run “traces” which shows you a discreet path that a particle would take through your model.
I will openly state right up front that I am not claiming to be an aerodynamics specialist or genius. I am however someone who was already comfortable with 3D modeling. The CFD analysis part has gotten a lot easier these days thanks to more powerful and easier to use software which I had easy access to. I work with people who are genius level guys who actually solved equations in the past to do work like this when things were not as easy. Without their help this study would not have been possible.
For a more in depth look this is a starting place:
https://en.wikipedia.org/wiki/Computational_fluid_dynamics
The 3D Solid Modeling Process:
I used a combination of “Solidworks” and “Linux FreeCad” to generate the 3D models which are based directly from my own CT scans. There are some small errors in the process of creating and “meshing” any 3D model but I consider these to be very minor compared to the large magnitude of surgical changes. These effects are the same on all models. Next, to simplify the model process, I disregarded the small outside edges of the middle turbinates. According to a study by (David Wexler, MD; Rebecca Segal, PhD; Julia Kimbell, PhD) ARCH OTOLARYNGOL HEAD NECK SURG/VOL 131, DEC 2005, only 3.5% to 3.8% of total inspired air passes through that area.(diagram borrowed below)

Next according to a Harvard study by (Wang, De Yun, Heow Peuh Lee and Bruce R. Gordon 2012) the sinuses are “ventilated” but very little air goes “through” the sinus cavities: “However, airflow going into the sinuses is negligible for a healthy nose, and this restricted amount of air exchange by the sinuses, through their ostia, helps to maintain stable intrasinus nitric oxide (NO) and humidity levels”. So for my modeling simplification, the sinus cavities were disregarded for my study of the “main” air pathways.
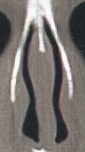
The last limitation of this study is that my pre-surgery CT scans did not go out to the tip of the nostrils. This study started as an effort to help myself. I needed to understand and compare to my pre-surgery state so all models start at the farthest available anterior location shown below. In this way, I am (again) testing and directly comparing nasal components.
Pre-surgery 2006 farthest anterior scan
The CFD Modeling analysis:
I used a program by Autodesk called “Simulation”. The settings for the CFD analysis on all models were analyzed by setting the anterior inlet surfaces to a boundary condition of “Pressure=0” and then pulling air in reverse through the models at 5L/minute and 10L/ minute starting from the last full planar surface prior to the opening of the nasopharynx. Changes, if any, are therefore similarly reflected on all models in the same way and can therefore be thought of as testing the behavior of similar “components” under similar conditions. All models were built in the same exact way so this is an “apples to apples” component level comparison. With that stated, my results compare very closely with other CFD studies. Wexler’s study found velocities of 100-150cm/sec mid cavity and their total volume flow setting was 15L/minute total but split between left/right at (8.26L/6.74R) L/minute. I chose this to compare my results against since it was one of the few studies that used such low flow rates right in between mine (5 and 10L/minute) and my results compare closely. Personally, as an ENS victim, I can’t even process anything other than minimal airflow rates and was mainly interested in modeling sleep at 5L/min and a low activity rate of 10L/min. A Harvard study defines normal inspiratory adult calm breathing at 5-12L/minute. One final note about my set up is that I treated both sides equally. The supply of air is NOT shared from 1 source like the throat into 2 separate nostrils. Each side was assigned it’s own set flow rate of either 5L or 10L/minute. Real world results would vary ESPECIALLY if one side was far more open than the other. In this case, air would pass through the path of least resistance (the more open side). I however prefer by far to see the individual performance of each side NOT affected by sharing a single supply.
Other CFD settings applied were: turbulent incompressible flow: ON, and a turbulence model of “Standard K epsilon”. One typical model contained 97407 total nodes, 61600 fluid nodes, 35791 solid nodes, 391,800 total elements, 152,000 fluid elements, 239,800 solid elements. 2 inlets and 2 outlets. Zero unknowns.
UNDERSTANDING RESULTS:
For the analytical purposes of creating simple and easy to understand velocity graphs, I divided the model image results into thirds: “Lower third”, “Middle third” and “Upper third”.

How to read the velocity scale:
Depending on the flow rate and model specifics, the correct scale (shown above) needs to be chosen to best show all details in each model. The images above for a 5L/minute flow rate are set to 0-200cm/second. If I were run a 10L flow rate and display results in the same 200 scale, most of the image would be red, thus the need to choose an appropriate scale setting to best show the full dynamic range. Whenever making side by side comparisons here I always use the same scale settings.
Interpreting results:
A Key to understanding these results is that the left side was normal prior to surgery. There were no pre surgical complaints with the left side so I consider the 2006 pre-surgery left side (right in images) results to be a “normal baseline” to compare against going forward from here. These left side pre-surgical results compare closely to Wexler’s study for that of a “normal nose”. This is also handy as it removes any question as to my modeling process as the result is an “apples to apples” comparison.
Most sources agree that the majority of the air we breathe travels through the middle of the nose in an arc like fashion. The book “Functional Reconstructive Nasal Surgery” by (Huizing/de Groot), states that “The inspiratory air stream takes a higher curved course and the expiratory airstream follows the lower passage way”. “After traversing the valve area, the air stream takes a more horizontal course. It hits the heads of the middle and inferior turbinates, enters the middle and to a lesser extent the inferior nasal passages and finally curved downward”. (emphasis added) Their pathways for IN and OUT are borrowed and shown below:

Starting with the supposition that the main inspiratory path is an arc like path through the middle and upper portion of the nose we can examine changes in airflow distribution as a direct result of these two surgeries.