
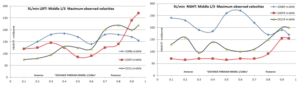
Graphical Chart Results before and after first two surgeries:
(Bilateral Inferior sub-total turbinectomy and septoplasty)

Key Findings:
These moves are not subtle, they are extreme in magnitude! Based on the above CFD model image results, local velocities in the upper nose were drastically cut by values ranging from 50 to 82%! Velocities in the middle of the nose where most of the air we breathe is located, were cut by 50% on the left and virtually flattened by 70-75% on the right side! We can see that the pre-surgery right side was indeed obstructed compared to the left. The left side (which was normal) had a healthy range of roughly 150-200cm/second (mid cavity) matching the Wexler study for “normal”. The right side was in excess of that indicating obstruction (narrower path with a fixed flow rate=higher velocity) however the surgical response (now flat lining at 70 cm/sec) was severe and totally unnecessary. Local peak velocities even dropped in the lower right side by 42-47% as volume increased. This is an unwelcome massive redesign of a natural structure.
Graphical Chart Results after second surgery
(After two bilateral Inferior turbinate reductions and two Septoplasties)

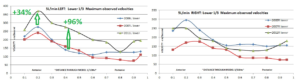
Key Findings:
The biggest changes in terms of pure distribution observed after a second bilateral turbinate reduction and septoplasty was a further drop in velocity for the upper right for a difference of 89 and 91% from my baseline prior to any surgeries. Even more airflow has been shifted to the lower nose with the left side seeing increases of 34% and 96% by mid cavity. The right side may have been my original issue for obstruction but removing so much inferior turbinate has left only 10% of the original flow remaining in the upper right side and has roughly halved flow in the middle. When compared to the normal left (150-200cm/second) the right is now scraping in the 50-75 cm/second range far below normal.
The second surgery has greatly intensified and concentrated the flow in the lower nose in what is now basically one big hot spot. There is also a very high velocity hot spot at the posterior (image #9 in 2-D CFD images) as compared to the much more evenly distributed pre surgery image #9. In a normal nose, air is equally distributed from the start and does not reach the throat in such a concentrated manner.
The Sphenopalatine nerve resides in this middle/posterior area and one such study by (Meng-Yang Di1, Zhe Jiang2*, Zhi-Qiang Gao1, Zhi Li2, Yi-Ran An2, Wei Lv1*) noted unnatural increased velocities in this area as a possible trigger for headaches in ENS patients: “Noticeably, in our study, velocities significantly increased around the sphenopalatine ganglion in the ENS-MT models (Figure 3-6, Table 1), thus the stimulation to the ganglion and its accessory nerves by the airflows would increase, which was likely to be the cause of headache associated with respiration.” I woke up with headaches nearly every day for years that were greatly reduced after getting implants.