
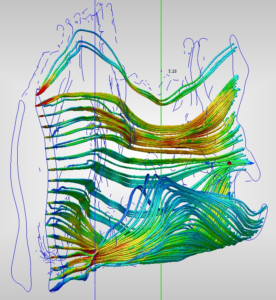
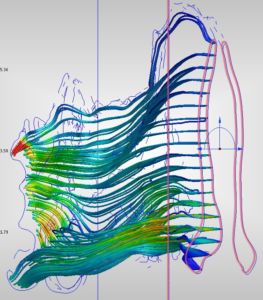
So far we have only seen 2D flat CFD image results. These give an overall color coded velocity for that slice but few clues about what the actual airstream would look like passing through the model. Fortunately, the modeling software “Simulation” by Autodesk, allows you to run traces trough your model and they follow the air path and provide a better visual understanding of EXACTLY how air flows through the nose. All models have the same tracer set up, an array of 20×40 traces.
3/D view Prior to any surgeries, 5L/minute
(Left side) (Right side)
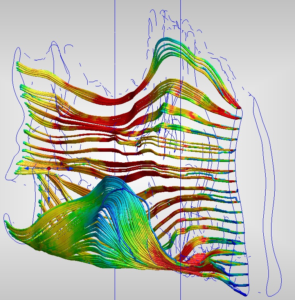
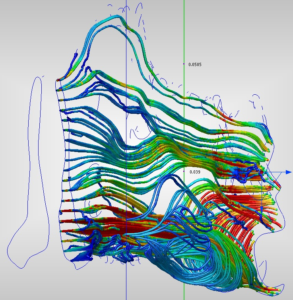
3/D view after first surgery, (Sub-Total Turbinectomy) 5L/minute
(Left side) (Right side) 
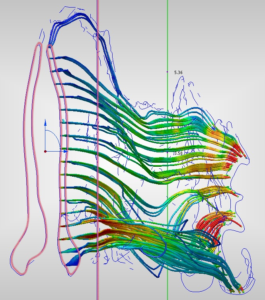
3/D view after second surgery, (after 2 inferior turbinate reductions and 2 septoplasties) 5L/minute
(Left side) (Right side)
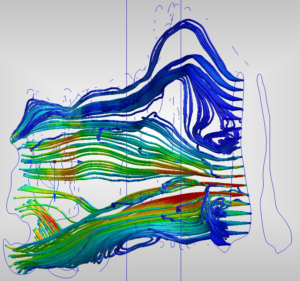
3-D image results Key Findings:
There are many HUGE changes to a left side which was normal to begin with. The most obvious is that air no longer streams upward around the inferior turbinate in the cavity area. There was an immense upward flow in green which evenly distributed contact with the walls of the cavity to share the load of filtering, humidifying and warming the inspired air which now goes straight through post-surgery. There is also markedly less flow at the ¾ model position behind the outer traces (toward the septum). The MAIN middle/upper airway path (as described by de Groot) did indeed have a higher velocity than the lower Inferior area. (.4 to .8 model location) This was red and is now blue/green post op. The highest traces into the olfactory area are greatly reduced from roughly 55 in light blue tracers down to 10 in dark blue. Lastly, there are now “hot spots” of less well processed high velocity air all the way back at the throat. (.8-.95 model area).
The right side was my main complaint prior to surgery but the results above are far more extreme than that of the left. There was a 67% to near 75% drop in the velocity through the middle of the nose. I went from obstructed to flat lining at 70cm/second which is well below the normal 150-200 observed by Wexler’s study and matched by my results for my normal left side. Clearly this change is orders of magnitude beyond merely “providing some additional air” for someone and well into the realm of destroying the natural distribution of air for a normal healthy human nose. Sub-Mucosa resections are preferred for a reason and Total and Sub-total turbinectomies are dangerous and higher risk for a reason! Even though many people may survive aggressive surgeries it does not mean it was the best thing for them. The simple goal of providing more air can be accomplished more safely through out-fracture or by intra-turbinate reducing techniques like the SMR that I agreed to and did not get. The cutting and removing or large cross sectional areas should clearly be avoided.